Weather & Climate Basics: What's the Difference, and How Both Work
Weather describes the atmosphere's short-term condition, while climate is the long-term statistical average of that weather for a place, typically measured over 30 years.
Reading time
— 5 min
Updated
— Aug 16, 2026
Fact-reviewed
— Aug 16, 2026
Key Takeaways
Key Takeaways
1Weather is what the atmosphere is doing right now or in the next few days; climate is the long-term average of that weather for a place, typically calculated over 30 years — 'climate is what you expect, weather is what you get.'
2Nearly all weather traces back to uneven solar heating: warm air rises and creates low pressure, cool air sinks and creates high pressure, and wind is simply air flowing from high pressure toward low pressure to even things out.
3Instrumental records, ice cores, and satellite data all show Earth's average surface temperature has risen roughly 1.1-1.2°C since the late 1800s — a decades-long trend documented by NASA and NOAA that a single cold day or storm doesn't contradict.
The concept
Weather is what's happening in the sky today — is it raining, how hot is it, is the wind strong. Climate is what that place is like on average, year after year — a desert has a dry climate even on the rare day it rains, and a tropical region has a hot, humid climate even on its one unusually cool morning. One is a snapshot; the other is a long-term pattern built from thousands of those snapshots.
Understanding that weather and climate operate on different timescales is the key to reading almost any forecast, headline, or data chart about the atmosphere correctly — including the mechanism that produces day-to-day weather in the first place.
Quick check
Why does wind blow from one place to another instead of the air just sitting still?
Worked examples
Example 1: Why the equator is warmer than the poles (baseline case)
Sunlight strikes the equator almost straight on, close to a 90° angle, concentrating its energy over a small surface area. At the poles, the same amount of sunlight arrives at a shallow, oblique angle, spreading that energy across a much larger surface area — the same beam of light "paints" a bigger patch of ground, so each square meter receives less energy. Polar ice and snow also reflect a large share (roughly 80-90%) of the sunlight that does arrive, rather than absorbing it as heat. This temperature difference between equator and poles is the engine behind global wind belts: warm equatorial air rises and flows toward the poles, cool polar air sinks and flows back toward the equator, and Earth's rotation deflects these flows into the recognizable large-scale wind patterns meteorologists track.
Example 2: El Niño disrupting normal weather patterns worldwide (edge case / variation)
Every few years, sea surface temperatures in the tropical Pacific Ocean rise well above average in a pattern called El Niño (the cooler counterpart is La Niña); together they're known as ENSO, tracked by NOAA's Climate Prediction Center. This isn't a local curiosity — a warmer tropical Pacific shifts the location of rising and sinking air on a global scale, which redirects jet streams and rainfall patterns across multiple continents at once. A strong El Niño typically brings wetter winters to the southern United States, drier conditions to parts of Southeast Asia and Australia, and altered hurricane activity in the Atlantic. It's a clear example of how a single regional ocean-temperature anomaly can cascade into weather effects thousands of kilometers away.
Quick check
During a strong El Niño event, weather patterns shift across multiple continents at once. What is actually driving this?
Example 3: Reading a real climate record — CO₂ and global temperature (real-world / applied case)
NOAA's Global Monitoring Laboratory has measured atmospheric carbon dioxide continuously at Mauna Loa Observatory in Hawaii since 1958. That record shows CO₂ rising from about 315 parts per million in 1958 to over 420 parts per million in the 2020s — a sustained, decades-long increase, not a single anomalous reading. Over that same period, NASA and NOAA's independently maintained global temperature datasets show Earth's average surface temperature climbing in step, consistent with the basic greenhouse mechanism: more CO₂ traps more outgoing infrared energy. This is what a genuine climate signal looks like in the data — a steady trend across thousands of measurements at hundreds of stations over many years, which is exactly why a single cold week doesn't undo it any more than a single hot week would prove it on its own.
How it works (visual)
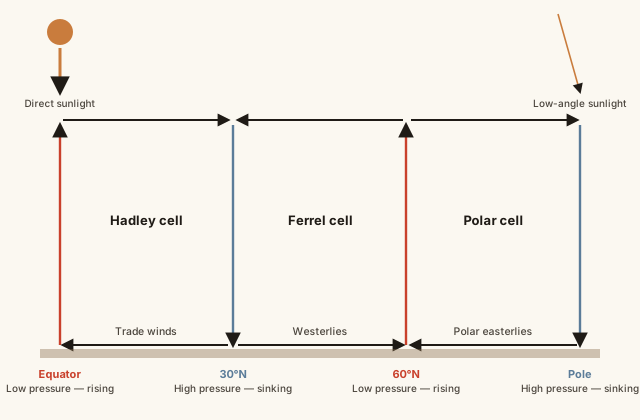
Global wind and pressure belts driven by uneven solar heating
Follow the rising air column at the equator: it climbs, cools, and splits, flowing poleward at high altitude before sinking back down around 30° latitude — this loop is a Hadley cell, and it's why deserts like the Sahara sit near that latitude band, under descending, drying air. Two more circulation loops (the Ferrel and Polar cells) carry that pattern the rest of the way to the poles. Every surface wind belt you can name — trade winds, westerlies, polar easterlies — is the surface-level signature of these three stacked circulation loops responding to the same underlying cause: more heat at the equator than at the poles.
Common mistakes
Common Mistakes
✕
Treating a single unusual weather event — a heat wave, a cold snap, a snowstorm — as proof or disproof of a climate trend.
→ Climate trends are measured as averages over decades across many stations. One event is a weather data point, far too small a sample to confirm or deny a multi-decade statistical pattern.
✕
Assuming humidity and temperature always rise and fall together.
→ They're independent — a day can be cool and humid, or hot and dry. Humidity depends on how much water vapor the air is holding relative to what it could hold at that temperature, not on temperature alone.
✕
Assuming climate change means uniform warming everywhere, with no cold days or regional variation allowed.
→ A rising global average is consistent with some regions warming faster than others, and with cold extremes still occurring — a warming trend shifts the odds and the average, it doesn't eliminate variability.
Common misconception
“A record cold snap or heavy snowstorm disproves global warming.”
A single storm is weather; the warming trend is a climate signal measured across decades of global average temperature data from NASA and NOAA — the two operate on completely different timescales and aren't in tension. In fact, a warmer atmosphere holds more water vapor (roughly 7% more per °C of warming, a well-established relationship), which can fuel heavier precipitation events, including intense snowfall, when temperatures are still cold enough for snow. A single extreme cold event happening within a warming multi-decade trend isn't a contradiction — it's exactly what climate science predicts can still occur.
Quick check
A major snowstorm hits during a winter that NOAA later reports was part of a warming multi-decade trend. Is this a contradiction?
Try it yourself
Estimate dew point from temperature and humidity
Approximate dew point (°C)17
What to do next
What to do next
Next time a forecast surprises you, check whether it's driven by a nearby high- or low-pressure system — most day-to-day weather traces back to that one variable.
Look up whether your region is currently in an El Niño, La Niña, or neutral ENSO phase to understand why a season is running wetter, drier, warmer, or cooler than usual.
Compare a single day's temperature to your region's 30-year climate normal, rather than to 'yesterday' or 'last week,' to judge whether it's actually unusual.
Read the related entry on Seasons & Earth's Tilt to see the other major driver of long-term temperature patterns beyond weather systems.
FAQ
FAQ
Related terms
Related terms
Weather
The state of the atmosphere at a specific place and time — temperature, humidity, wind, cloud cover, and precipitation over minutes to days.
Climate
The long-term statistical average of weather for a region, typically calculated over a 30-year period.
Air mass
A large body of air with fairly uniform temperature and humidity, which takes on the characteristics of the surface it formed over.
Atmospheric pressure
The force exerted by the weight of air above a given point; differences in pressure between regions are what create wind.
Greenhouse effect
The process by which gases like carbon dioxide and water vapor trap outgoing infrared radiation in the atmosphere, warming the planet's surface.
El Niño / La Niña (ENSO)
A recurring cycle of warmer (El Niño) or cooler (La Niña) than average sea surface temperatures in the tropical Pacific that shifts weather patterns worldwide.
 KnowThis