 KnowThis
Key Takeaways
Key Takeaways
- 1The IUCN Red List classifies extinction risk using measurable criteria — population size, rate of decline, and geographic range — not a subjective judgment call, ranking species from Least Concern up to Extinct.
- 2Extinction is permanent by definition — once the last individual of a species dies, that genetic lineage cannot be recovered, which is why 'Extinct' and 'Critically Endangered' are treated as fundamentally different categories.
- 3Habitat loss, not hunting alone, is the leading driver of species endangerment worldwide today, according to IUCN and WWF data.
The concept
That decline-rate criterion behind the Red List categories isn't just a label — it's an actual number, and running it forward across a few years shows exactly how a "Vulnerable" population can slide toward "Critically Endangered" faster than intuition suggests.
Two species both have shrinking populations. Species A is losing 2% of its population per year; Species B is losing 20% per year. Why does the IUCN Red List treat these very differently, even though both are 'declining'?
Worked examples
Example 1: Projecting a population decline over 10 years (baseline case)
Example 2: The northern white rhino — functionally extinct but not yet formally extinct (edge case / variation)
Only two northern white rhinos remain alive, both female, unable to reproduce naturally. Why do conservationists describe this as 'functionally extinct' rather than simply 'extinct'?
Example 3: How the bald eagle's recovery shows the Red List categories can move both directions (real-world / applied case)
The bald eagle was listed as endangered in the contiguous United States by the mid-20th century, its population crashing largely due to the pesticide DDT thinning eggshells until they broke under the weight of nesting parents, combined with habitat loss and hunting. Following the 1972 U.S. ban on DDT, along with habitat protection and legal protection under the Endangered Species Act, bald eagle populations recovered substantially over subsequent decades, and the species was removed from the U.S. endangered species list in 2007. This is a real-world, applied demonstration that extinction-risk categories aren't a one-way ratchet toward extinction — a species' classification can improve significantly when the specific factors driving its decline (in this case, a single identifiable chemical) are directly addressed, which is exactly the kind of evidence-based, data-driven outcome the whole Red List classification system is designed to track and respond to.
How it works (visual)
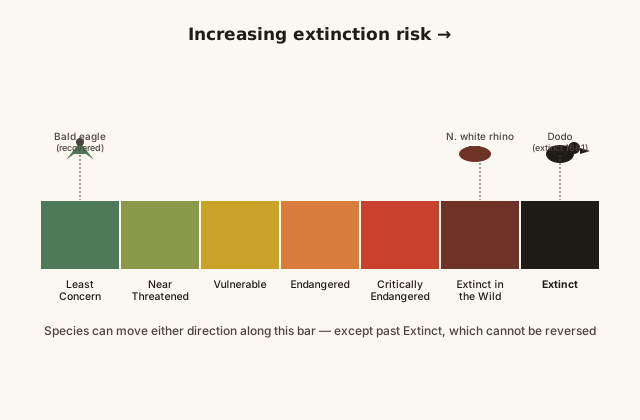
The gradient captures something the word "endangered" alone doesn't: extinction risk is a spectrum with defined, measurable steps, not a simple binary of "fine" versus "gone." A species can move in either direction along this bar — the bald eagle moved left (toward lower risk) after its main threat was addressed, while a species facing worsening habitat loss or declining population moves right, toward Critically Endangered and, eventually, if nothing changes, Extinct — the one category on the bar that, once reached, cannot be reversed.
Common mistakes
Common Mistakes
Assuming hunting is always the main cause of species endangerment.
→ Habitat loss and degradation is the leading driver of species endangerment worldwide today, according to IUCN and WWF data — hunting and overexploitation are significant but generally secondary factors for most currently threatened species.
Treating 'endangered' and 'extinct' as basically the same level of concern.
→ They're fundamentally different: endangered species are still alive and, as the bald eagle shows, can recover if the right conditions are restored. Extinction is permanent — there's no possible recovery once every individual is gone.
Assuming a species with a large total population can't be at meaningful extinction risk.
→ Rate of decline and range fragmentation matter as much as raw population size in Red List criteria — a large but rapidly declining or severely fragmented population can still be classified as highly threatened.
Common misconception
“Extinction is a slow, purely natural background process that has always happened at roughly the same steady rate throughout Earth's history, so today's extinctions aren't unusual.”
The fossil record shows a natural, ongoing background extinction rate, but it also shows that this baseline has been dramatically exceeded at specific points in Earth's history — five recognized mass extinction events, including the one that ended the age of non-avian dinosaurs roughly 66 million years ago. Many researchers, drawing on data compiled by organizations including the IUCN and cited by the Smithsonian, estimate that current extinction rates for well-studied groups like vertebrates run tens to potentially hundreds of times above the natural background rate — a gap large enough that a substantial body of scientific opinion describes the present era as a possible sixth mass extinction, this one driven primarily by human activity (habitat loss, climate change, invasive species, overexploitation) rather than the asteroid impacts or volcanic events behind earlier mass extinctions.
Someone claims today's extinctions aren't a real concern because species have always gone extinct throughout Earth's history. What's the most accurate response?
Try it yourself
What to do next
What to do next
- Try the calculator above with a lower decline rate (like 3%) versus a higher one (like 25%) over the same 10 years to see just how much the compounding rate itself matters, not just the starting population.
- Look up a species you're curious about on the IUCN Red List website to see its actual assigned category and the specific data behind that classification.
- Next time you hear 'endangered,' mentally check whether the story is about population decline, habitat loss, or both — the two most common Red List drivers.
- Read the related entry on Evolution & Natural Selection Basics to see the flip side of this topic: how new species arise, not just how they're lost.